

We just published The State of AI Companions 2026 — a data-driven snapshot built from the real, declared attributes of 101 products we track in the isoulchat directory. No estimates, no modeled trends: every figure is computed straight from what each product says it does. The full thing is a free PDF, and this post is the short, opinionated version — the three numbers we think actually matter, and the caveats behind them.
Capability is splitting into two tiers
Here is the share of tracked products that offer each core capability:
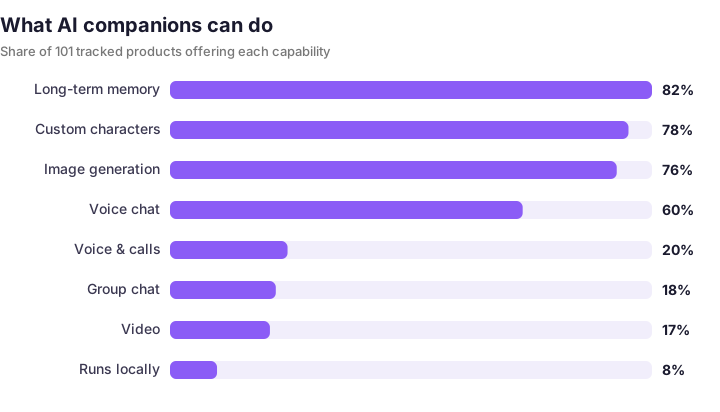
Two things jump out. First, long-term memory (82%) and image generation (76%) have quietly become table stakes. If you launch a companion today without persistent memory or the ability to generate a picture, you are below the median of an already-crowded field. Custom characters (78%) sit in the same tier.
Second, the gap below that line is where products actually differentiate. Voice chat shows up in 60% of products, but live voice & calls only in 20% — and video (17%), group chat (18%) and on-device running (8%) are still rare enough to be genuine differentiators rather than expectations. When a product leads with "real-time voice" or "video calls" — the way Kindroid and Nomi make voice a headline feature — it is not bragging about a commodity; it is pointing at a capability most of the market has not shipped yet.
The takeaway for builders: memory and images get you in the door. Voice quality and live calls are where the next tier of competition is being decided.
The market is still web-first
Where do these products actually live?
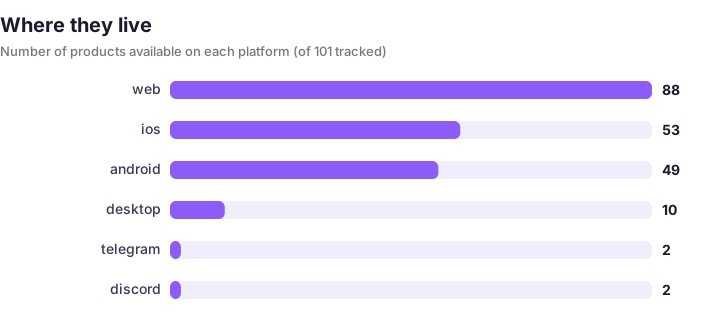
Web is everywhere (88 products); mobile is half as universal. iOS appears in 53 and Android in 49 — and a meaningful chunk of the field is web-only. That is a structural fact worth sitting with: the category was born in the browser, and even now the default surface is a tab, not a phone.
For users, this means the best experience is often on desktop, and the mobile apps that do exist are uneven. For builders, it is a reminder that a polished web client still reaches more of the market than a flawed native app — and that the Android/iOS gap is an opening, not a penalty, for anyone willing to ship a good mobile build.
Free is the entry ticket, not the business
Pricing is the chart that surprises people most:
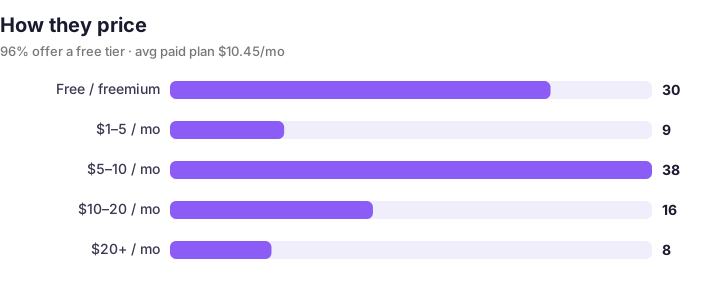
96% of tracked products offer some kind of free tier. Among paid plans, the average effective monthly price is about $10.45. The single largest paid band is $5–10/month — the "latte test": cheap enough to be an impulse, expensive enough to mean something.
What this tells you is that free is not a strategy, it is the cost of being considered. Nobody pays for a companion they have not tried, so everyone front-loads a free experience and monetizes a smaller, committed slice. If you are evaluating products, expect the free tier to be genuinely usable and the paid tier to be where memory depth, voice and image quality live — exactly the two-tier capability split from the first chart.
The flip side, which the data cannot show: retention and willingness to pay matter far more than the sticker price. A $10 product with 5% conversion can out-earn a $20 product with 1%.
What the numbers do not say
We are deliberately honest about the limits. This is a cross-sectional snapshot — 101 products, captured at one point in time. We do not have clean historical data across all of them, so we are not claiming "up 20% year over year." Where we lack the basis, we describe the structure as it is rather than invent a trend.
A few things the charts above leave out, by design:
- Orientation and visual style. The field skews heavily toward flexible / any-character companions (85 of 101) and realistic art (48) over anime (11) — but those are preference distributions, not quality signals.
- The long tail. Top categories are roleplay (51), create-your-own (49) and image-gen (47). The interesting products are increasingly in the niches those headline numbers obscure.
- Quality. Coverage is not competence. A product can check every box and still be a worse conversation than one that checks three.
Read the whole thing
If you want the complete picture — every category, the highest-volume tags, and our editor's picks for the year — the full 2026 report is a free PDF. It is built to be cited: journalists, researchers and other builders are welcome to use the figures, with or without attribution.
And if you are comparing specific products rather than the market as a whole, our side-by-side comparison tool lets you stack capabilities on the same axes this report measures.